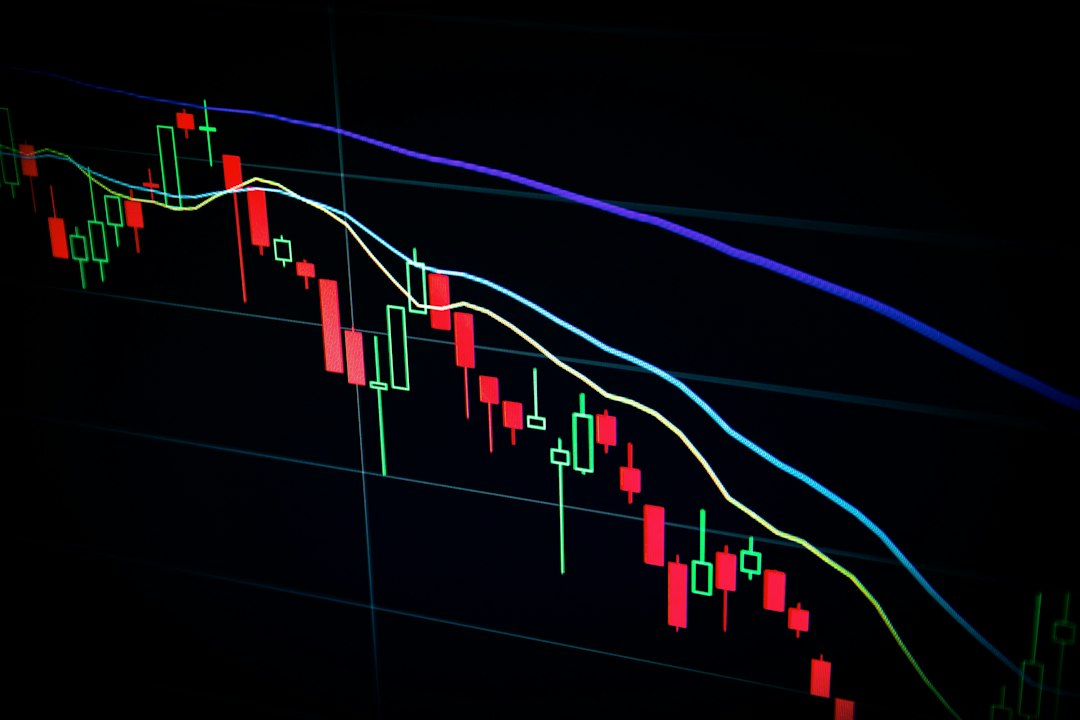
How to Read Candlestick Charts Like a Trader
by Ehsan
Candlestick charts are the foundation of technical analysis for Forex traders worldwide, including in Iran. Understanding how to interpret these visual price representations separates profitable traders from those who struggle. This guide will teach you the essential elements of candlestick reading, common patterns to watch, and how to apply this knowledge to real trading decisions without falling for unrealistic profit promises.
Understanding Candlestick Components
Every candlestick tells a story about price movement during a specific time period. The body shows the opening and closing prices, while the wicks (or shadows) display the highest and lowest prices reached. A bullish candlestick appears when the closing price exceeds the opening price, typically colored green or white. Conversely, a bearish candlestick forms when the price closes below the opening, usually displayed in red or black.
The length of the body indicates the strength of buying or selling pressure. Long bodies suggest strong momentum, while short bodies signal indecision or weak conviction. Wicks reveal rejection of higher or lower prices, providing crucial information about market sentiment and potential reversals.
Key Candlestick Patterns for Trading Decisions
Certain candlestick formations appear repeatedly across all timeframes and currency pairs. Recognizing these patterns helps traders anticipate potential price movements. Here are essential patterns every trader should master:
- Doji: Opening and closing prices are nearly identical, indicating market indecision and potential trend reversal
- Hammer and Hanging Man: Small body with long lower wick, suggesting rejection of lower prices and possible bullish reversal
- Engulfing Patterns: A larger candlestick completely "engulfs" the previous one, signaling strong momentum shift
- Morning Star and Evening Star: Three-candle patterns indicating potential trend reversals at support or resistance levels
Remember that no pattern guarantees profits. Always combine candlestick analysis with other technical indicators, fundamental analysis, and proper risk management strategies.
Comparing Single vs. Multiple Candlestick Patterns
| Pattern Type | Time to Form | Reliability | Best Use Case |
|---|---|---|---|
| Single Candle | 1 period | Moderate | Quick entry signals |
| Double Candle | 2 periods | Higher | Confirmation trades |
| Triple Candle | 3 periods | Highest | Reversal detection |
| Complex Patterns | 4+ periods | Variable | Major trend changes |
Practical Application for Iranian Forex Traders
When trading currency pairs through international platforms accessible from Iran, candlestick analysis becomes your primary decision-making tool. Start by focusing on major pairs like EUR/USD or GBP/USD on the 4-hour or daily timeframe. These periods filter out market noise and provide clearer signals.
Before entering any trade based on candlestick patterns, confirm the following: identify the overall trend using moving averages or trendlines, check support and resistance levels where patterns form, and verify volume or momentum indicators support your interpretation. Never risk more than 1-2% of your trading capital on a single position, regardless of how confident you feel about a pattern.
Avoiding Common Candlestick Reading Mistakes
Context matters more than the pattern itself. A bullish engulfing pattern at resistance may fail, while the same pattern at support combined with oversold conditions offers better probability. Many beginners make the mistake of trading every pattern they recognize without considering market structure, timeframe alignment, or confluence with other technical factors.
Additionally, different timeframes can show contradictory signals. A bullish pattern on the 15-minute chart means little if the daily chart shows a strong downtrend. Professional traders use top-down analysis, starting with higher timeframes to understand the major trend, then moving to lower timeframes for precise entry timing.
Mastering candlestick chart reading requires practice, patience, and disciplined risk management. Focus on learning a few reliable patterns thoroughly rather than trying to memorize dozens. Combine your candlestick analysis with sound money management, and you'll develop a sustainable trading approach. Start practicing on a demo account, document your observations, and gradually build confidence before risking real capital in the Forex markets.