What Is Technical Analysis in Forex Trading?
by Ehsan
Technical analysis is the study of historical price movements and trading volume to forecast future currency price direction. Unlike fundamental analysis that examines economic news and geopolitical events, technical analysis focuses entirely on price charts, patterns, and mathematical indicators. For traders in Iran and worldwide, mastering technical analysis provides a systematic approach to making trading decisions without relying on subjective interpretation of news events. This guide explains what technical analysis is, how it works, and which tools traders use most effectively in Forex markets.
Understanding the Foundation of Technical Analysis
Technical analysis operates on three core principles that apply to all financial markets including Forex. First, price discounts everything — meaning all known information is already reflected in current prices. Second, prices move in trends that can be identified and followed. Third, history tends to repeat itself as traders react to similar market conditions in predictable ways.
These principles mean that by studying past price behavior, traders can identify patterns that suggest what might happen next. Chart patterns, support and resistance levels, and indicator readings become the trader's primary tools for decision-making. For Iranian traders accessing global Forex markets, technical analysis works the same way regardless of local conditions, making it a universal language of trading.
Key Technical Analysis Tools and Indicators
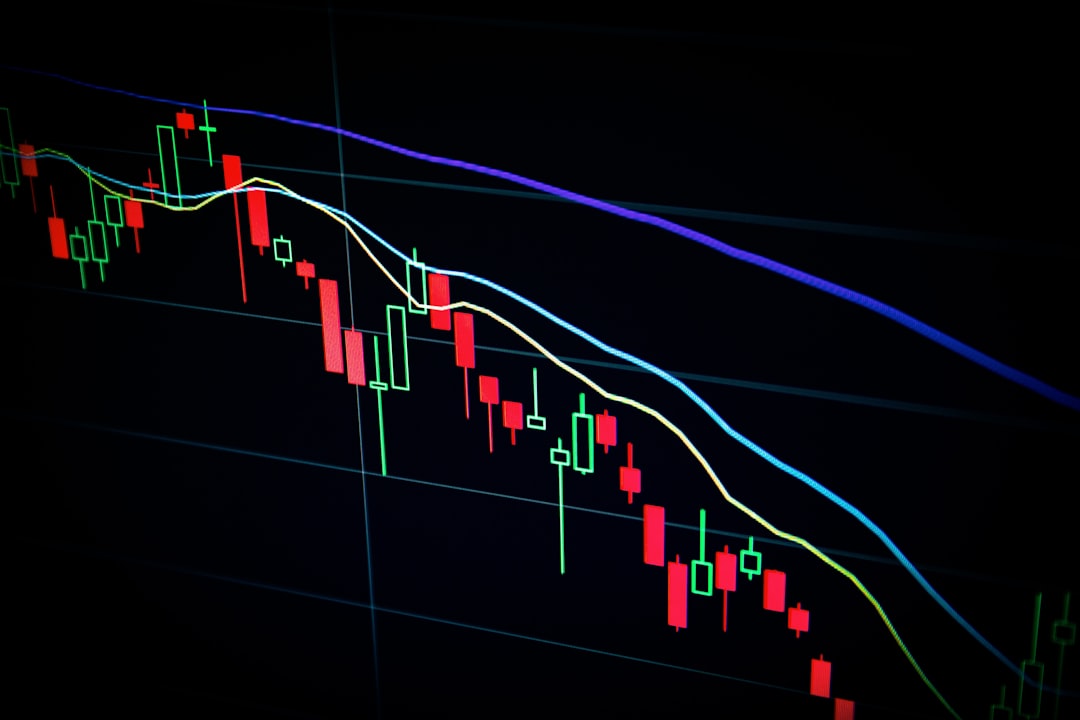
Successful technical traders rely on a combination of tools to analyze currency pairs. The most essential include candlestick charts that show open, high, low, and close prices for each time period. Support and resistance levels mark price zones where currencies historically reverse or break through. Trendlines connect price highs or lows to visualize market direction.
| Indicator Type | Primary Use | Best For |
|---|---|---|
| Moving Averages | Identify trend direction | Trend following |
| RSI (Relative Strength Index) | Measure overbought/oversold conditions | Reversal signals |
| MACD | Spot momentum changes | Entry/exit timing |
| Bollinger Bands | Measure volatility | Breakout trading |
Beginners should start with simple moving averages and RSI before adding more complex indicators. Overloading charts with too many indicators creates confusion rather than clarity.
Reading Price Patterns and Chart Formations
Technical analysts identify recurring price patterns that suggest probable future movements. Continuation patterns like flags and pennants indicate the current trend will likely resume after a brief pause. Reversal patterns such as head and shoulders or double tops signal potential trend changes.
Candlestick patterns provide additional insights into market sentiment. A doji candlestick shows indecision, while engulfing patterns suggest strong directional momentum. Learning to recognize these formations takes practice, but they work across all timeframes from 5-minute charts to daily and weekly charts. Iranian traders can apply these same pattern recognition skills whether trading EUR/USD, GBP/JPY, or any other currency pair on international platforms.
Combining Multiple Timeframe Analysis
Professional traders analyze multiple timeframes to get a complete market picture. The top-down approach starts with higher timeframes (daily or weekly) to identify the major trend, then moves to lower timeframes (4-hour or 1-hour) to find precise entry points.
For example, if the daily chart shows EUR/USD in an uptrend, look for buying opportunities on the 4-hour chart when price pulls back to support. This multi-timeframe confirmation reduces false signals and improves trade quality. Never trade against the trend on higher timeframes unless you have strong reversal evidence from technical indicators and price patterns.
Limitations and Risk Management Considerations
While powerful, technical analysis has limitations traders must understand. It cannot predict unexpected news events that cause sudden volatility. False breakouts and whipsaws occur when price briefly breaks technical levels before reversing. No indicator or pattern guarantees success.
Effective risk management remains essential regardless of technical signals. Use stop-loss orders on every trade, never risk more than 1-2% of account capital per trade, and avoid revenge trading after losses. Technical analysis works best when combined with proper position sizing and emotional discipline. For traders in Iran navigating international Forex markets, these risk management principles apply universally across all brokers and platforms.
Technical analysis provides Forex traders with objective tools for reading market behavior and making informed decisions. By mastering chart reading, indicators, and pattern recognition, you develop skills that work in any market condition. Start with basic tools, practice on demo accounts, and gradually build your technical analysis expertise for consistent trading performance.